exoatlas provides some basic tools for helping identify targets that might be observable, either for quick single visits or for extended transit observations that need to be scheduled at very specific times. To demonstrate, let’s make a few populations of exoplanets.
import exoatlas as ea
import astropy.units as u
import matplotlib.pyplot as plt

ea.version()'0.7.9'e = ea.TransitingExoplanets()nearby_transiting_planets = e[e.distance() < 15 * u.pc]
one_transiting_planet = e["GJ1214b"]e, nearby_transiting_planets, one_transiting_planet(✨ Transiting Exoplanets | 4731 elements ✨,
✨ Transiting Exoplanets | 38 elements ✨,
✨ GJ1214b | 1 elements ✨)What’s up at night?
Let’s imagine we want to point a telescope at an exoplanet system to take an image or spectrum of it. At a particular moment on a particular night from a particular observatory location, we’ll need to know if the star is visible in our local sky. To start, let’s define the observatory location and time at which we want to observe:
from astroplan import Observer

observatory = Observer.at_site("APO", timezone="US/Mountain")
observatory
<Observer: name='APO',
location (lon, lat, el)=(-105.82000000000002 deg, 32.78000000000001 deg, 2798.0000000005284 m),
timezone=<DstTzInfo 'US/Mountain' LMT-1 day, 17:00:00 STD>>from astropy.time import Time
date = Time("2026-06-01")
night = observatory.midnight(date)Now, we can calculate the altiude and azimuth of all elements from that observatory at that time. We can also calculate the “airmass” ( = how much more Earth atmosphere we look through compared to zenith), where targets with airmass > 2 start might start getting a little too low toward the horizon to be worth observing.
positions = e.altaz(where=observatory, when=night)
airmass = e.airmass(where=observatory, when=night)
fi, ax = plt.subplots(2, 1, constrained_layout=True, figsize=(8, 8))
plt.sca(ax[0])
kw = dict(c=airmass, cmap="Reds_r", vmax=2, marker=".")
plt.title(f"What's up? | {night.iso} | {observatory.name}")
plt.scatter(e.ra(), e.dec(), **kw)
plt.xlabel("Right Ascension (degrees)")
plt.ylabel("Declination (degrees)")
plt.xlim(360, 0)
plt.ylim(-90, 90)
plt.colorbar(label='airmass')
plt.sca(ax[1])
plt.scatter(positions.az, positions.alt, **kw)
plt.xlabel("Azimuth (degrees)")
plt.ylabel("Altitude (degrees)")
plt.xlim(360, 0)
plt.ylim(-90, 90)
plt.colorbar(label='airmass');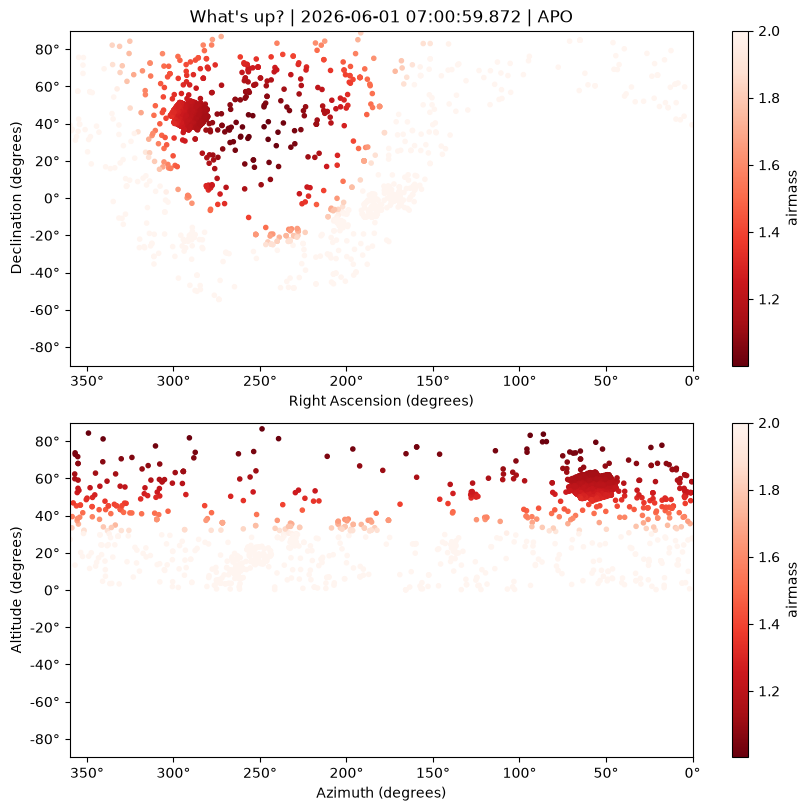
Neat! It looks like the Kepler field (= the very dense blob) is high in the sky this time of year!
When can we observe a transit?
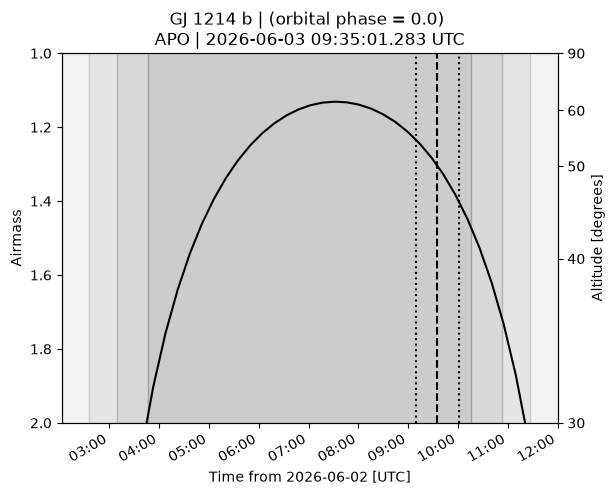
A slightly tricker question is when another transit can be observed for a transiting exoplanet system. For observing a transit, we need the star to be up, the Sun to be down, and the planet to pass in front of the star. We can calculate when all these stars align using astroplan, wrapped inside the .show_upcoming_transits method.
We can find observable transits for a single planet by specifying:
whereas anastroplan.Observerobject for the location from which you’re observingwhenas anastropy.time.Timeobject for the time from which you’d like to start considering transitswindowas anastropy.unit.Quantityobject with units of time, to indicate how long of a window over which you’d like to search for transits
a_few_transits = one_transiting_planet.show_upcoming_transits(
    where=observatory, when=date, window=10 * u.day
)
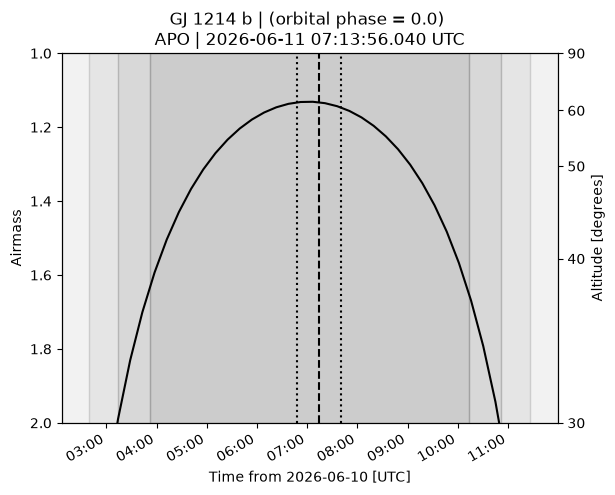
This function returns a table, indicating the transit ingress, midoint, and egress, all as astropy Time objects.
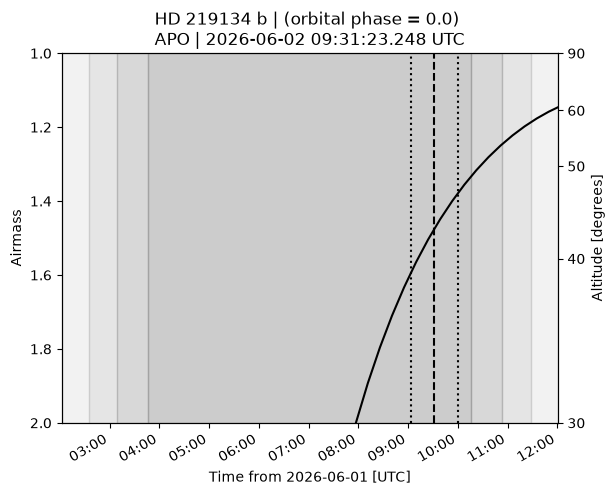
a_few_transitsWe can also search for any observable transits for any planet in a larger population.
lots_of_transits = nearby_transiting_planets.show_upcoming_transits(
    where=observatory, when=date, window=10 * u.day
)
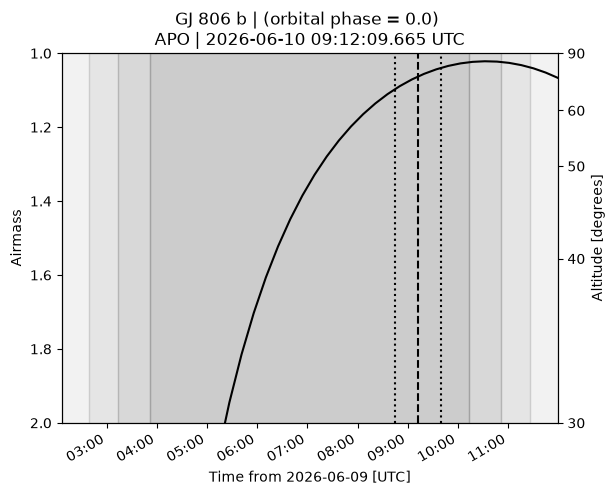
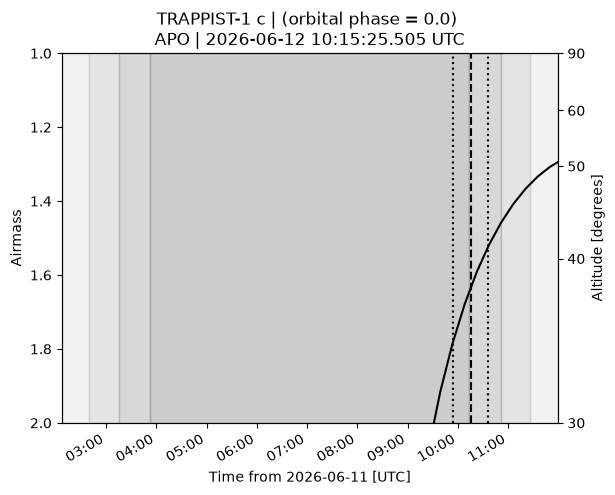
If any planets in a population are missing the data needed to plan a transit (period, transit_midpoint, transit_duration), they’ll appear in a table indicating what needs to fixed (for example, with .update_values) in order for transits to be predicted.